Moving averages are trend indicators that show where the trend of an asset is headed. In this article, you will discover how to use moving averages in trading your favourite forex pairs or cryptocurrencies.
What is a moving average?
The simplest definition of a moving average is that it is the mean of the most recent prices for an asset. The moving average is calculated by taking a time period, recording the total price for that time period, and dividing the answer by the number of days that make up the period in view. For instance, a 200-day moving average line is calculated by adding the prices for the most recent 200 days, and dividing the result by 200. The emphasis is on using the most recent price data.
Characteristics of a Moving Average
The following are what makes up a moving average’s character:
- A moving average is a trend indicator.
- It is a lagging indicator, which means that is shows a signal when the trend is already formed.
- There are different types of moving averages: simple, exponential and weighed (volume-weighted and linear-weighted).
- Shorter-period moving averages react faster and have less lag than longer-period moving averages.
Types of Moving Averages
There are 3 main types of moving averages:
- Simple
- Exponential
- Weighted
The simple moving average (SMA) gives equal weighting to the price on all days that make up the period used in the calculation. It does not give stronger weighting to the most recent price data, hence it tends to lag a lot. More about the SMA can be found in this forex guide.
The exponential moving average (EMA) is an improvement on the SMA, as it gives stronger weighting to the most recent price data, making it less likely to lag and more reactive to the trend than the SMA.
How the Moving Average is Used
Moving averages are used in the following ways:
- Used alone, a moving average functions as a dynamic support/resistance line. It can be used to trade price bounces in the direction of the trend.
- They can be used to detect trend changes, when several moving averages of different time periods are used. In this manner, a crossover signal is usually used (double or triple crossover).
- A moving average can also be combined with an oscillator.
Using One Moving Average
Trying to use a single moving average to detect trend changes simply by change in direction of the line will not produce successful outcomes. Sometimes, many signals are generated and may end up whipsawing the trader’s positions. On the other hand, too few signals are generated and a lot of missed opportunities will result.
Therefore, a better way will be to use the single moving average line as a dynamic support/resistance tool. As a dynamic support, you buy when price bounces on the line from above. As a dynamic resistance, you sell when price is rejected as it comes from below.

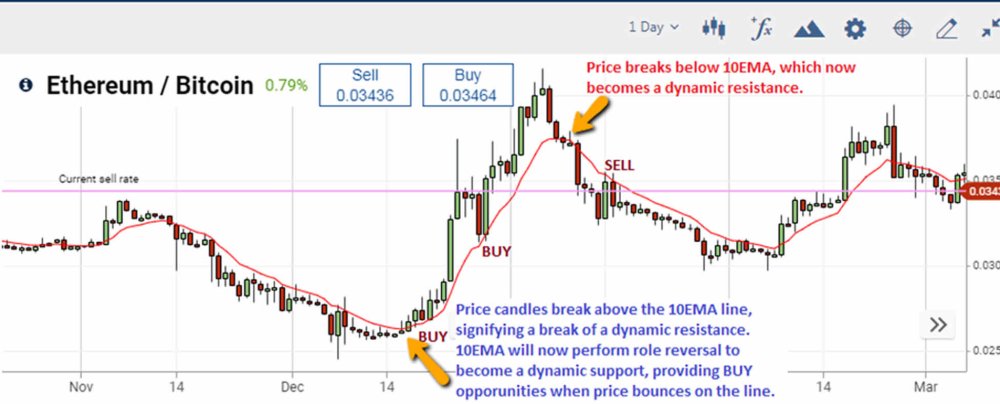
Daily Chart of ETH/BTC Showing Buy and Sell Opportunities on One Moving Average
As we can see from the chart above, the moving average (10EMA) served as a dynamic support/resistance, capable of performing role reversal after price has crossed from one side to another. The first opportunity was a buy setup, where prices went steeply higher, retreated a little to the 10EMA and bounced on it, creating a 2nd buy opportunity. Following this, price crossed below the 10EMA, went lower before pushing back higher but was rejected at the 10EMA line. From here, a SELL trade could be initiated to follow continuation of price down south.
Using Two Moving Averages
Another way to deploy the moving averages in forex or crypto is to combine a short-period moving average with a long-period moving average in what is known as a crossover. The principle behind the crossover is that the short-period moving average will cross the long-period moving average in the direction of the new trend. The trade can then be taken by allowing the price to bounce (Buy) or be rejected (Sell) at a moving average, AFTER the cross has occurred. Common combinations use the 10-day and 50-day moving averages, or to use the 10-day and 50-day moving averages as the short/long period moving averages.

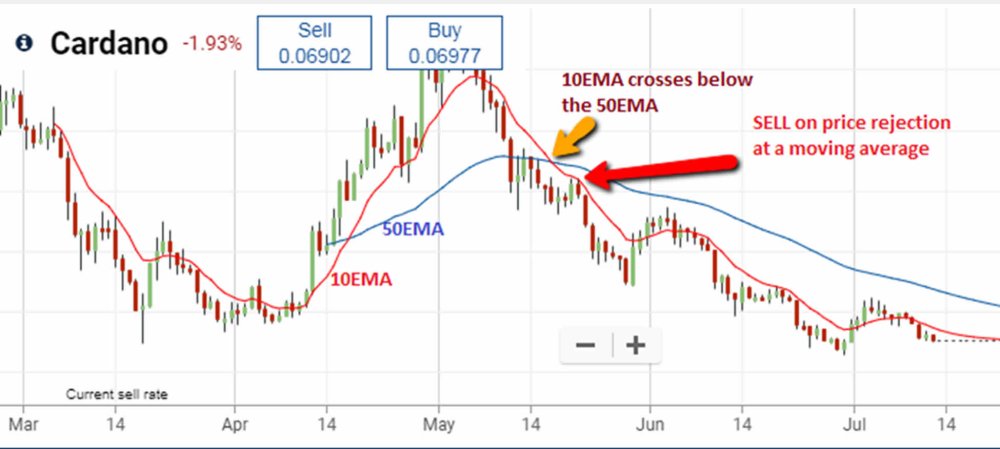
Moving Average Crossover Strategy On Cardano Showing Short Trade Setup
In this example, we see that the short-period moving average (10EMA) has crossed below the long-period moving average (50EMA), after which price attempted a pullback to the upside but was rejected at a moving average line. This is the moment to initiate a SELL order, and as we can see from the chart, price tanked thereafter. Long trades follow similar principles, but to the upside.

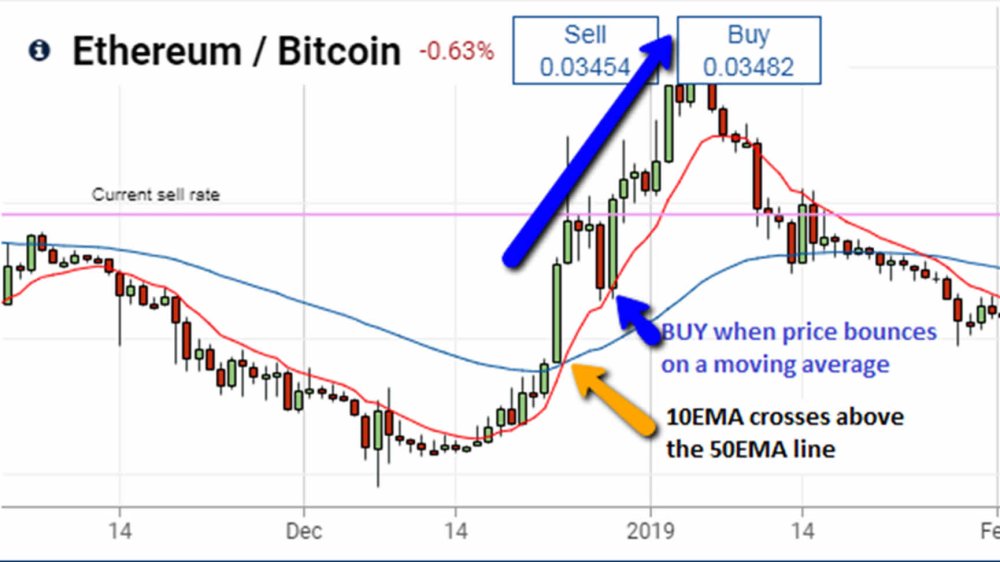
Moving Average Crossover Strategy On ETH/BTC Showing Long Trade Setup
On this chart, the 10EMA (red line) crossed above the 50EMA (blue line), with price subsequently dropping to bounce off the 10EMA line. It is at the point of the bounce that the trader can initiate a buy trade. We can also see that price marched upwards thereafter.
Triple Moving Average Cross
In 1972, a trader named R.C. Allen described the use of three moving averages in a crossover strategy. This strategy uses the following time periods for the moving averages:
- 4EMA, 9EMA and 18EMA.
- 5EMA, 10EMA and 20EMA
These moving averages use price data for time periods which correspond to a short period, a medium period and a long period. Each moving average is expected to cross the next moving average in a sequence, producing the trading signal only when all the crosses have been completed. Furthermore, this is a strategy used more for trend change detection, so signals work best when price is at extremes.

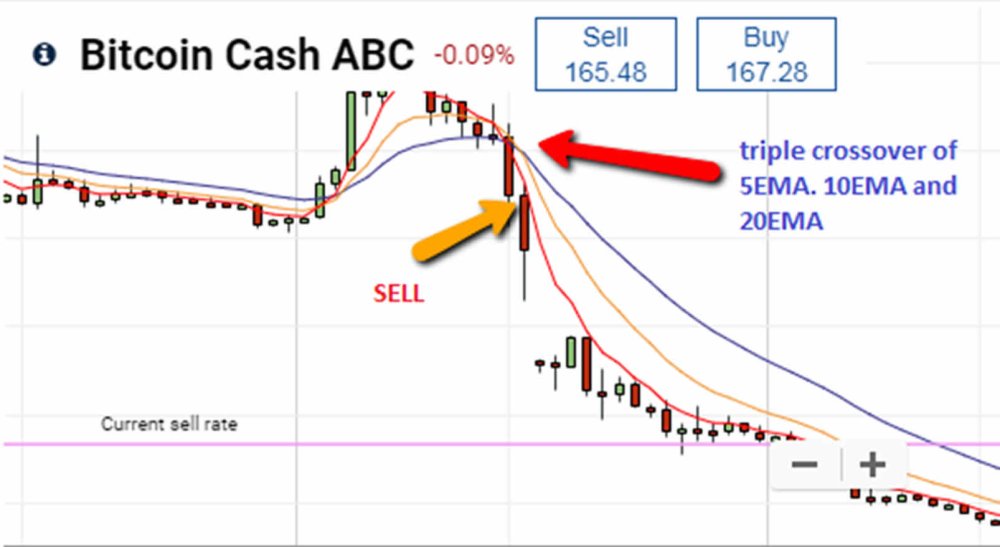
Triple Moving Average Crossover on Bitcoin Cash ABC
The setup for Bitcoin Cash ABC above shows how the triple moving average crossover system works. Here, the 5EMA (red line) crossed below the 10EMA (yellow line), and both moving averages also crossed below the 20EMA (blue line). The short trade is then initiated at the rejection of the next candle on a moving average line. A long trade setup works similarly, but in the opposite direction.


