Last week, we received some positive news as both the CPI and PPI numbers came in lower than expected. This news is likely to support the stock market overall, as it may give the Federal Reserve more confidence to begin lowering interest rates towards the end of the year. Although the recent FOMC decision was a bit more hawkish than anticipated, Fed Chair Powell emphasized that their forecasts are subject to change based on data, which the market seemed to take into account. While risk sentiment remains uncertain, there are signs that the negative mood from the previous week is beginning to fade.
S&P 500 Technical Analysis – Daily Timeframe
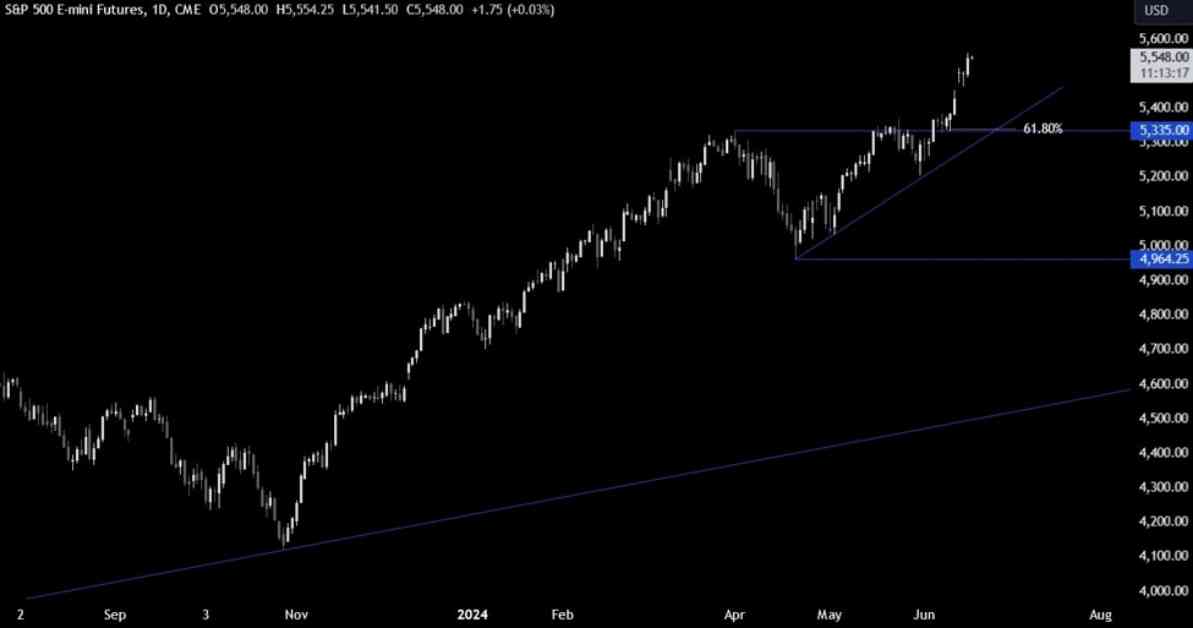
Looking at the daily chart, the S&P 500 continues to reach new all-time highs, even as other risk assets struggle to gain momentum. The market saw a strong upward movement recently without a specific catalyst, indicating that the path of least resistance remains to the upside. Buyers may find a better risk to reward setup near the trendline, where the previous all-time high and the 61.8% Fibonacci retracement level converge. However, a significant pullback is unlikely unless there is extremely negative US data.
S&P 500 Technical Analysis – 4 hour Timeframe
On the 4-hour chart, there is a strong support zone around the 5450 level, where a minor trendline and the 38.2% Fibonacci retracement level intersect. If the price reaches this level, buyers may use the trendline as a support level to position themselves for another rally with a favorable risk to reward ratio. Conversely, sellers will be looking for a break below this level to increase their bearish positions towards the next trendline around 5350.
S&P 500 Technical Analysis – 1 hour Timeframe
In the 1-hour chart, there is a minor support level around 5510. If weak US Retail Sales data causes a dip in price to this level, buyers may step in to fade the reaction and prepare for new highs. Sellers, on the other hand, will be watching for a break below this level to increase their bearish bets towards the trendline at 5450. The red lines in the chart represent the average daily range for the day.
Upcoming Catalysts
Today, we are expecting US Retail Sales and US Industrial Production data. Later in the week, we will see US Housing Starts, Building Permits data, and the latest US Jobless Claims figures on Thursday. Finally, on Friday, we will end the week with the US PMI data. These upcoming events may provide additional insights into the market’s direction and potential opportunities for traders.


